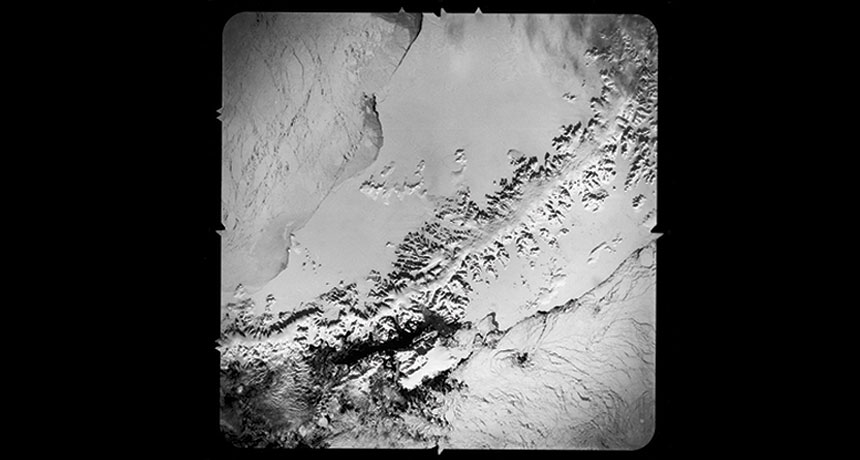
Spy satellites reveal early start to Antarctic ice shelf collapse

The biggest ice shelf collapse on record was set in motion years earlier than previously thought, new research reveals.
Analyzing declassified images from spy satellites, researchers discovered that the downhill flow of ice on Antarctica’s Larsen B ice shelf was already accelerating as early as the 1960s and ’70s. By the late 1980s, the average ice velocity at the front of the shelf was around 20 percent faster than in the preceding decades, the researchers report in a paper to be published in Geophysical Research Letters.
Rising temperatures since the 1950s probably quickened the ice flow, which in turn put more strain on the ice and further weakened the shelf, says study coauthor Hongxing Liu, a geographer at the University of Cincinnati. Previous work had suggested that the ice shelf’s downward slide began only a few years before a Rhode Island-sized region of ice disintegrated into thousands of icebergs in 2002.
The new data will help scientists more confidently predict how Antarctic ice will fare in the coming decades, says Penn State glaciologist Richard Alley, who was not involved in the work. The early response of Larsen B to warming “is consistent with this ice shelf system being sensitive, and gives a target for future modeling studies to learn how sensitive, and for what reasons,” he says.
Ice shelves such as Larsen B line Antarctica’s coast and slow the flow of the continent’s glaciers and ice sheets into the sea. Rising temperatures are shrinking Antarctica’s ice, with several ice shelves on track to disappear completely within 100 years (SN Online: 3/26/15). Tracking the long-term decline of ice shelves is tricky, though. Scientific satellite images are sparse prior to the 1990s and next to nonexistent before the 1980s.
Liu and colleagues turned to another group that peered at Antarctica, a U.S. intelligence agency called the National Reconnaissance Office. In 1963, the agency photographed the continent as part of an intelligence-gathering mission. While these images were declassified in 1995, the photos were too distorted by effects such as the camera used and Earth’s curvature to use for ice flow measurements.
Making the photographs usable required identifying stationary landmarks for reference, a difficult task on a continent covered with shifting white ice. Comparing the spy photos with later scientific images, Liu and colleagues identified 44 potential landmarks. Then, using the locations as anchor points, the researchers unwarped the images. Along with additional satellite images snapped in 1979 and the 1980s, the modified images allowed the researchers to track Larsen B’s ice flow over time.
The ice on Larsen B’s front flowed at around 400 meters per year on average between 1963 and 1986, calculations using images from those years indicate. From 1986 to 1988, the average was 490 meters per year. That speed boost suggests that the ice flow accelerated between the 1963 to 1986 satellite images. Several glaciers that feed into Larsen B underwent similar accelerations, the researchers found.
Larsen B’s early acceleration hints that the ice shelf was already weakening well before the 1990s, says Ted Scambos, a polar scientist at the National Snow and Ice Data Center in Boulder, Colo., who was not involved in the study. Previous studies suggested that balmy surface temperatures caused Larsen B’s demise by forming meltwater pools on top of the ice shelf that forced open cracks in the ice (SN: 10/18/14, p. 9). The new satellite data suggest that this fracturing was a finishing blow following long-term weakening by forces such as relatively warm seawater eroding the ice shelf’s underside, Scambos says.